Dept. of Rehabilitation Science and Technology, University of Pittsburgh, Pittsburgh, PA 15260
Human Engineering Research Laboratories, Department of Veterans Affairs, Pittsburgh, PA 15206
ABSTRACT
Activity monitors have a potential to measure the physical activity levels and motivate wheelchair users towards a physically active lifestyle. In this study we have evaluated the performance of two activity monitors in estimating energy expenditure (EE) in manual wheelchair users with spinal cord injury. The results of this study indicate that compared to the criterion EE collected by the metabolic cart, the SenseWear overestimated EE between 17.8% for deskwork to 131.4% for wheelchair propulsion at 3mph on dynamometer, while the RT3 underestimated EE between 21.4% for deskwork to 53.3% for arm-ergometry exercise at 40W at 60rpm.
KEYWORDS:
Wheelchair Propulsion, Arm-ergometry Exercise, Energy Expenditure, Activity Monitor
BACKGROUND
People with spinal cord injury (SCI) who rely on manual wheelchairs as their primary means of mobility face special challenges in engaging in regular physical activity. Individuals with SCI mainly use their upper extremities for locomotion, exercise, recreational and other activities of daily living. Several physiological factors, including the relatively small muscle mass that is under voluntary control, deficient cardiovascular reflex responses, and decreased blood circulation in the legs, can markedly reduce their capacity for arm activity [(1)]. Such physiological changes along with mobility limitations explains the high percentage of wheelchair users leading a sedentary lifestyle [(2)].
The positive effects of physical activity on reducing or mitigating secondary conditions such as deconditioning and pain, increasing cardiorespiratory fitness and muscular strength, and improving quality of life are well documented in persons with SCI [(2)]. However, such physical activity interventions are monitored in controlled laboratory settings and physical activity participation in free-living conditions is frequently assessed through self-report [(3)]. There is no validated objective tool, to our knowledge, that allows these individuals to gauge their physical activity levels in free-living conditions and enables professionals to evaluate interventions that aim to promote physical activity participation in this population.
Extensive studies have been performed to evaluate the reliability and usefulness of pedometers and activity monitors (AMs) in measuring physical activities and predicting daily energy expenditures in ambulatory populations without disabilities [(4), (5)]. Quantified information about regular physical activity has been used to motivate users to continue or alter their physical activity behaviors [(6)]. On the other hand these pedometers or AMs cannot be simply applied to manual wheelchair users with SCI who often have volitional movements only in the upper extremities. A primary objective of this study was to examine the performance of SenseWear (SW) and RT3 on the waist (RT3W) AMs to estimate energy expenditure (EE) in manual wheelchair users with SCI for resting and performing three types of physical activities including wheelchair propulsion, arm-ergometer exercise, and deskwork.
METHODOLOGY
Experimental Protocol:
 Figure
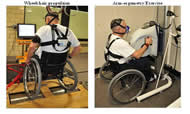
1: Subject propelling his wheelchair on the dynamometer and performing
arm-ergometry exercises
Figure
1: Subject propelling his wheelchair on the dynamometer and performing
arm-ergometry exercises The study was approved by the Institutional Review Board at the University of Pittsburgh and the VA Pittsburgh Healthcare System. Subjects were recruited based on the inclusion criteria, that they were between 18 and 60 years of age, used manual wheelchair as a primary means of mobility, have a SCI of T1 or below and were at least six months post-injury. Subjects had to obtain a physician release prior to participating in the study. After the study was explained to the subjects, they had to provide a written consent. As part of the study the subjects answered a questionnaire, provided subject parameters and participated in resting and three activity sessions, including wheelchair propulsion (Figure 1), arm-ergometer exercise (Figure 1), and desk work. Subject parameters comprised of measuring weight, height (if the participants were not aware of it) and skinfold measurements at biceps, triceps, subscapular and suprailiac. The body fat percentage of the subjects was estimated by using the average value of the skinfold measurements. The activity sessions were counterbalanced and the trials in the activity session were randomized to counter order effects.
 Figure
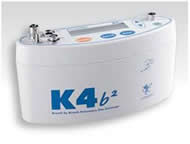
2: Portable metabolic cart used as the criterion measure to measure
energy expenditure in the subjects
Figure
2: Portable metabolic cart used as the criterion measure to measure
energy expenditure in the subjectsSubjects wore portable metabolic cart K4b2 (Figure 2) connected to a face mask and two AMs (Figure 3) on the body while performing the activities. SW AM was placed on the upper right arm and an RT3 AM was placed on the waist (RT3W). The subjects performed each activity trial for a maximum period of 8 minutes (min) with a resting period of 5 to 10 minutes between each trial and a period of 30 to 40 minutes between each activity session. In the propulsion activity the subjects’ wheelchairs were restrained on a stationary dynamometer for two trials with a monitor in front to provide speed feedback in miles per hour. After practicing for two minutes, the subjects propelled their wheelchairs for two trials of 2 miles per hour (mph) and 3mph on the dynamometer (dyno) and a trial of 3mph on a flat tiled floor. The arm-ergometer exercise included three trials of 20 watts (W) resistance at 60 rotations per minute (rpm), 40W at 60rpm and 40W at 90rpm. During the desk work activity session the subjects used a computer and read a book, spending four minutes for each sub-activity.
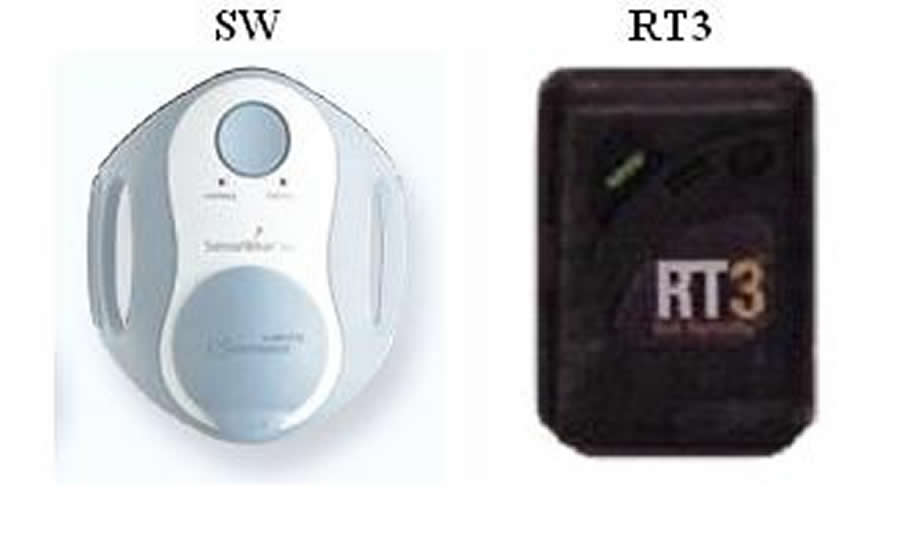 Figure 3: Activity monitors used to estimate energy expenditure
in the subjects
Figure 3: Activity monitors used to estimate energy expenditure
in the subjects Instrumentation and Data Collection:
The weight, height and skin fold measurements were measured using wheelchair scale, tape measure and Lange® skinfold caliper, respectively. K4b2 metabolic cart was used as the criterion measure in the study. K4b2 metabolic cart has been shown to be both valid and reliable in the general population [(7)]. SW and RT3 AMs were used to estimate EE in this study. The SW utilizes tri- axial acceleration, skin temperature, galvanic skin response and heat flux at the upper arm while the RT3 utilizes tri-axial acceleration at the waist to estimate EE. Previous studies have tested these AMs in the ambulatory population without disabilities and have shown good performance in predicting activities and EE [(4), (5)]. To ensure accuracy of the metabolic cart, the system was calibrated for every subject. The metabolic cart, SW and RT3 were synchronized before use. The data collected from the metabolic cart included EE in kcal/ min, heart rate (HR), VO2 and VCO2 in mL/min/kg for each breath. The data collected from the AMs included EE in kcal/min, raw multi-sensor data from SW (InnerView Research Software 4.2) and acceleration data from RT3 (RT3 ASSIST Software). Subjects were also asked to provide a rate of perceived exertion (RPE) on the Borg’s scale after each trial with 0-1 for nothing at all to very weak activity, 2-5 for weak to strong activity, and 7-11 for very strong to absolute maximum activity.
Data Analysis:
The EE in kcal/min from the AMs was compared with the EE obtained from the metabolic cart after the response stabilized. The collected data from the metabolic cart, SW and RT3 were reduced to a minute data using MATLAB® (Ver. 7.6.0.324 R2008a, The Mathworks, Inc., Natick, MA) data analysis software. Data from the third minute to the sixth minute was utilized for the analysis. The data from the RT3W for the eighth participant was lost due to device malfunction and was not included in the analysis. The comparisons between the criterion EE and the EE from the AMs were performed by calculating paired t-tests and the agreement was examined through absolute difference, percentage error, Bland and Altman plots and mean absolute error (MAE) plots. The absolute difference (∆EE) and the percentage error (∆EE%) between the EE measured (EE_MET) using the metabolic cart and the EE estimated (EE_AM) by the AM for all the activity trials were obtained by applying equations (1) and (2). Also Pearson moment correlations (R) were calculated between the EE estimated by the SW and RT3W AMs with respect to the EE measured by metabolic cart for resting, wheelchair propulsion, arm-ergometry exercise, deskwork and all activities together. Statistical analysis was performed using SPSS software (ver. 15.0, SPSS Inc., Chicago, IL).
Demographic Variable |
Number |
Mean (SD) |
||
Gender |
Male |
10 |
- |
|
|
Female |
3 |
- |
|
Ethnicity |
Caucasian |
11 |
- |
|
|
African American |
1 |
- |
|
|
Other |
1 |
- |
|
Age in years |
- |
44 (10) |
||
Weight in kg |
- |
79.8 (19.6) |
||
Height in cm |
- |
178.7(10.5) |
||
Body fat in percentage |
- |
28 (6) |
||
Tobacco smoking |
Non-Smoker |
12 |
- |
|
|
Smoker |
1 |
- |
|
Perceived fitness level (Likert Scale) |
- |
3.5 (1.1) |
||
Manual wheelchair usage in years |
- |
15.4 (7.22) |
||
Activity |
EE kcal/min (SD) |
METs (SD) |
HR in beats/min (SD) |
RPE (SD) |
|
Resting |
1.4 (0.5) |
0.8 (0.2) |
63.1 (13.4) |
0.0 (0) |
|
Wheelchair propulsion |
2mph on dyno |
3.9 (1.7) |
2.8 (0.9) |
94.5 (31.8) |
3.1 (1.7) |
3mph on dyno |
5.2 (2.7) |
3.8 (1.5) |
111.5 (40.2) |
4.7 (2.6) |
|
3mph on tile |
3.0 (1.1) |
2.2 (0.5) |
92.4 (22.1) |
2.2 (1.4) |
|
Arm-ergometry |
20W at 60 rpm |
3.4 (0.5) |
2.5 (0.3) |
92.7 (29.6) |
1.8 (1.8) |
40W at 60 rpm |
4.6 (0.6) |
3.5 (0.8) |
107.3 (36.9) |
3.5 (2.8) |
|
40W at 90 rpm |
5.7 (0.7) |
4.2 (0.6) |
123.3 (41.0) |
5.5 (3.2) |
|
Deskwork |
1.5 (0.4) |
1.1 (0.2) |
80.3 (17.6) |
0.5 (0.5) |
|
RESULTS
The demographic characteristics of the subjects are indicated in Table 1. Data from the questionnaires indicated that 6 subjects reported regular physical activity such as wheelchair basketball, weight lifting and arm-ergometry, while the rest reported only occasional or no physical activity. In addition the level of SCI among the subjects varied from T4-L2 with 6 of the 13 subjects having complete injury.
Activity |
EE in kcal/min (SD) |
Paired t-test P value |
||||
Metabolic Cart |
SW |
RT3W |
Metabolic cart - SW |
Metabolic cart - RT3W |
||
Resting |
1.4 (0.5) |
1.3 (0.3) |
1.2 (0.4) |
0.61 |
0.34 |
|
Wheelchair propulsion |
2mph on dyno |
3.9 (1.7) |
8.8 (4.7) |
2.9 (1.7) |
0.00* |
0.06 |
3mph on dyno |
5.2 (2.7) |
9.7 (5.0) |
4.2 (3.8) |
0.02* |
0.19 |
|
3mph on tile |
3.0 (1.1) |
6.4 (1.9) |
2.7 (1.6) |
0.00* |
0.59 |
|
Arm-ergometry |
20W at 60 rpm |
3.4 (0.5) |
5.4 (1.5) |
2.0 (1.1) |
0.00* |
0.00* |
40W at 60 rpm |
4.6 (0.6) |
6.0 (1.2) |
2.3 (1.5) |
0.00* |
0.00* |
|
40W at 90 rpm |
5.7 (0.7) |
7.8 (2.5) |
3.1 (1.8) |
0.00* |
0.00* |
|
Deskwork |
1.5 (0.4) |
1.5 (0.3) |
1.3 (0.5) |
0.54 |
0.27 |
|
* Represents EE values that were significantly different with P<0.05 |
||||||
The metabolic costs in terms of kcal/min, metabolic equivalent of task (MET), HR (beats/min) and RPE for the four types of physical activities are indicated in Table 2. The EE measured from metabolic cart, EE estimated from SW and RT3W AMs, and the results of paired t-tests between EE measured and EE estimated from AMs is shown in Table 3. The EEs estimated from the SW and the RT3W were compared with the EE measured form the metabolic cart (Table 4). Furthermore Bland and Altman plots of metabolic cart versus SW and RT3W were also constructed (Figure 4). From the results we note that the SW and the RT3W overestimated EE and underestimated EE, respectively. The MAE of SW and RT3W compared to the EE from the metabolic cart for each subject indicated the EE estimation variation as a whole for each subject (Figure 5). Additionally Pearson product-moment correlation coefficients were calculated between the EE estimated by AMs and the criterion EE (Table 5), in order to estimate the variance explained by the EE of the AMs in the criterion EE.
Activity |
Absolute Difference in kcal/min (SD) |
Percentage Error % (SD) |
|||
SW |
RT3W |
SW |
RT3W |
||
Resting |
0.3 (0.2) |
0.5 (0.6) |
23.9 (19.1) |
32.5 (25.1) |
|
Wheelchair propulsion |
2mph on dyno |
4.9 (4.0) |
1.4 (1.8) |
131.4 (93.1) |
33.1 (29.5) |
3mph on dyno |
4.4 (4.0) |
2.0 (2.8) |
98.1 (72.4) |
31.1 (27.7) |
|
3mph on tile |
3.4 (1.3) |
1.3 (1.8) |
122.2 (59.7) |
39.2 (30.1) |
|
Arm-ergometry |
20W at 60 rpm |
2.0 (1.2) |
1.6 (1.2) |
60.0 (36.6) |
46.6 (21.4) |
40W at 60 rpm |
1.5 (1.0) |
2.5 (1.5) |
33.7 (28.2) |
53.3 (21.8) |
|
40W at 90 rpm |
2.3 (1.5) |
2.8 (1.8) |
39.8 (23.7) |
48.7 (23.7) |
|
Deskwork |
0.2 (0.2) |
0.4 (0.6) |
17.8 (15.3) |
21.4 (25.7) |
|
DISCUSSION
Activity monitors have been extensively studied to measure physical activities and predict activity-related EE among the ambulatory population without disabilities [(4), (5), (6)]. Availability of such AMs in manual wheelchair users with SCI has a potential to provide effective information that can assist persons to continually alter their physical activity behaviors. In this study we have tried to evaluate the performance of two off-the-shelf AMs in estimating EE in this population.
Activity |
SW |
RT3W |
||||
R2 |
R |
P value |
R2 |
R |
P value |
|
Resting |
0.41 |
0.64 |
0.02* |
0.00 |
0.05 |
0.86 |
Wheelchair propulsion |
0.41 |
0.64 |
0.00* |
0.36 |
0.60 |
0.00* |
Arm-ergometry exercise |
0.49 |
0.70 |
0.00* |
0.12 |
0.34 |
0.03* |
Deskwork |
0.36 |
0.60 |
0.03* |
0.01 |
-0.07 |
0.82 |
All Activities |
0.56 |
0.75 |
0.00* |
0.34 |
0.58 |
0.00* |
* Represents correlations that were significant with P<0.05 |
||||||
The research showed that the EE and HR measured for propulsion and arm-ergometry exercises increased with increase in speeds and resistances. In addition the RPE values reported by the subjects increased with increase in speeds and resistances showing trends similar to the EE measurements. The MET data indicated that wheelchair propulsion on dyno at 3mph (3.8±1.5) and arm-ergometery exercise at 40W at 60rpm (3.5±0.8) and 40W at 90rpm (4.2±0.6) were moderate, while the rest of the activity trials were light. Especially propelling on tile floor at 3mph was a light-intensity activity (2.2±0.5), comparable to walking at 2mph in the ambulatory population. The lower MET data for wheelchair propulsion on tile versus dyno can be attributed to less rolling resistance on the tile compared to the dyno.
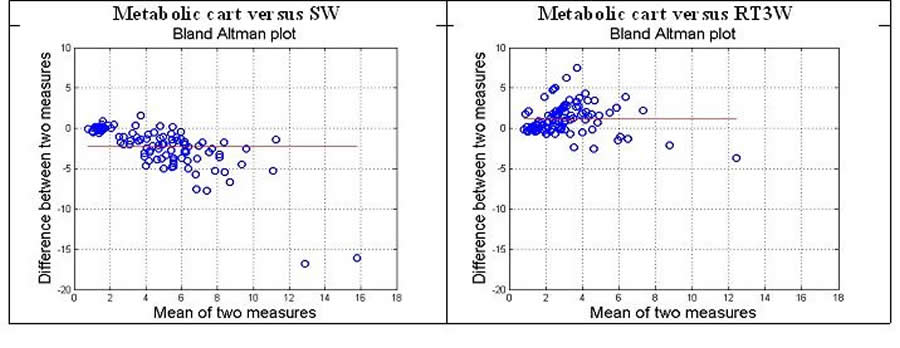 Figure 4: Bland Altman plots of metabolic cart versus SW and RT3W
 Primary findings of the study show that the EE estimated by SW was significantly different for propulsion and arm-ergometry trials, while the EE estimated by RT3W was significantly different for arm-ergometry trials (Table 3). On closer examination of the absolute error and percentage difference it was found that SW consistently overestimated EE, while RT3W consistently underestimated EE for all the activity trials (Table 4). Since resting is a major part of everyday activity (~65% of time) the close EE estimation by the two AMs in persons with SCI for resting may improve the daily EE estimation in manual wheelchair users with SCI. There are several possible explanations for the over and underestimation of EE by SW and RT3W for propulsion and arm-ergometry exercises. The main reason is that the SW and RT3W use algorithms specifically developed for ambulatory population [(4), (5)]. Unlike the majority of AMs that use single regression equations for all types of activities, the SW first classifies the activity into a predefined category and then uses the activity-specific equations to estimate EE [(4)]. As the classification algorithms were evaluated and refined based exclusively on the ambulatory population, propulsion and arm-ergometry cannot be among the predefined activity categories, and thus were possibly misclassified into a strenuous type of activity such as jogging, which lead to greater EE estimation. The RT3W estimates EE based on a single equation that takes into account the subject parameters and the activity counts measured by the device at the waist. The absence of the biomechanical bounce at the waist for the wheelchair users may have reflected in the underestimation of EE by the AM.
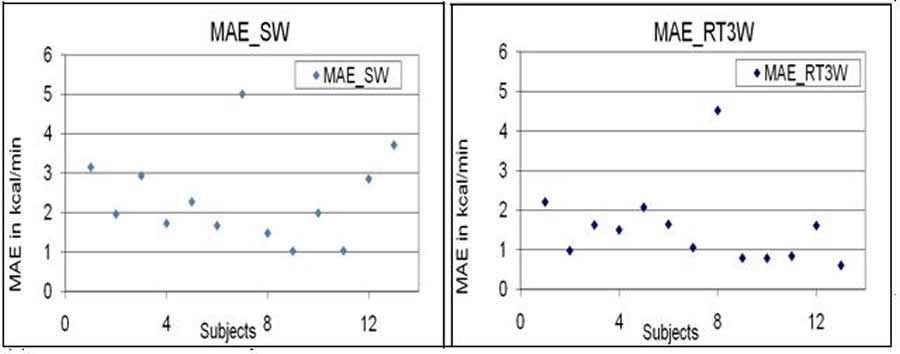 Figure 5: Plots of mean absolute error (MAE) of EE estimated by
SW and RT3W compared to the EE from the metabolic cart for each subject
Figure 5: Plots of mean absolute error (MAE) of EE estimated by
SW and RT3W compared to the EE from the metabolic cart for each subject Secondary findings of the study show that the variance in the criterion EE explained by the SW (41% and 49%) for wheelchair propulsion and arm-ergometry were higher compared to the variance explained by the RT3W (36% and 12%). The higher variance explained by the SW may signify that AMs worn on the arm in manual wheelchair user may be more reflective to physical activities involving upper arms compared to the AMs worn at the waist. Additionally the SW was able to predict greater variance (56%) in the EE compared to the RT3W (34%) for all activities together. The ability of SW to predict greater than 50% of variance in EE indicates that new activity specific prediction equations designed in manual wheelchair users with SCI can aid in estimating regular physical activity in this population.
REFERENCES
- Glaser, R.M., Janssen, T.W.J., et al., (1996). The Physiology of Exercise. In D. F. Apple (Ed.), Physical Fitness: A Guide for Individuals with Spinal Cord Injury, 1-24. Department of Veterans Affairs, Scientific and Technical Publications Section: Washington.
- Buchholz, A.C., McGillivray, C.F., et al., (2003). Physical Activity Levels Are Low in Free-Living Adults with Chronic Paraplegia. Obesity Research, 11(4), 563-570.
- Liusuwan, R.A., Widman, L.M., et al., (2007). Behavioral intervention, exercise, and nutrition education to improve health and fitness (BENEfit) in adolescents with mobility impairment due to spinal cord dysfunction. Journal of Spinal Cord Medicine, 30(S1), S119-S126.
- Jakicic, J.M., Marcus, M., et al., (2004). Evaluation of the SenseWear Pro armband to assess energy expenditure during exercise. Medicine & Science in Sports & Exercise, 36(5), 897-904.
- Jacobi, D., Perrin, A.-E., et al., (2007). Physical activity-related energy expenditure with the RT3 and tritrac accelerometers in overweight adults. Obesity, 15, 950-956.
- Polzien, K.M., Jakicic, J.M., et al., (2007). The efficacy of a technology-based system in a short-term behavioral weight loss intervention. Obesity, 15(4), 825-830.
- Duffield, R., Dawson, B., et al., (2004). Accuracy and reliability of a Cosmed K4b2 portable gas analysis system. Journal of Science and Medicine in Sport, 7(1), 11-22.
ACKNOWLEDGEMENTS
The work is supported by RERC on Recreational Technologies and Exercise Physiology Benefitting Persons with Disabilities (H133E070029) funded by National Institute on Disability Rehabilitation Research (NIDRR). The work is also supported by PVA 2264-01 and VA Center of Excellence for Wheelchairs and Associated Rehabilitation Engineering B3142C
CONTACT INFORMATION
Shivayogi Hiremath, Human Engineering Research Laboratories, 7180 Highland Dr., 151R1-H, Pittsburgh, PA 15206. 412-638-0020. svh4@pitt.edu Word Version PDF Version